Question
A digital filter has the transfer function: (a) What is the value of a at which the filter becomes unstable and why? [2]
1a) The filter becomes unstable beyond This is because z has a pole at , and for the system to be stable the magnitude of this pole, i.e.
Question
(b) a is set to a = 0.5. Sketch the filter’s frequency response by calculating its response for DC, its Nyquist frequency and with that information drawing a rough graph of it. Label both x and y axis appropriately. [8]
I cant bee bothered sketching, but it looks kind of like half a bell curve
Question
(c) Draw a dataflow diagram of the filter [5]
Question
(d) Somebody has written python code of the filter:
class Filter:
	buffer = 0
	a = 0.5
	def filter(self,v):
		"""Sample by sample filtering
		v -- scalar sample returns filtered sample
		 """
		self.buffer = v - self.a * self.buffer
		return buffer
Question
i) A unit test sends in the values 2,4,−2 into the filter Eq. Q1. Execute the code by hand for the 3 steps by comparing actual and expected values returned from the filter. [6]
step 1: buffer = 0, v=2, buffer = 2 returned null
step 2: buffer = 2, v = 4 buffer = 3 returned null
step 3: buffer = 3, v = -2 buffer =-3.5 returned null
expected: 2, 5, 0.5
Question
ii) Decide if the filter is working properly or not, provide an explanation and possibly fix the bug. [4]
The primary bug is that buffer is returned, not self.buffer which is the correct term, so this filter isnt returning anything, but on top of that another bug lies with the computation subtracting a *buffer from v, instead of adding, which is a trivial mistake that comes from reading and taking that sign, instead of inverting it. This needs to be made into a plus to function as intended.
Question
FIR filter design in the frequency domain (a) Sketch the frequency response of an ideal bandstop filter. [5]
cba
Question
(b) Perform an inverse Fourier transform analytically of a ideal bandstop amplitude response to obtain the impulse response of the filter. [10]
Question
(c) At a sampling rate of 1 kHz one wants to create a 2 Hz notch filter at 50Hz. How many taps are needed theoretically and practically. Provide explanations for both choices. [6]
This filter has a bandwidth of 4Hz, at a sampling rate of 1kHz, meaning that we need approximately 250 taps in theory, for such a small window, but practically more like 500 taps, such that our transition is sharper between stopband and passband
Question
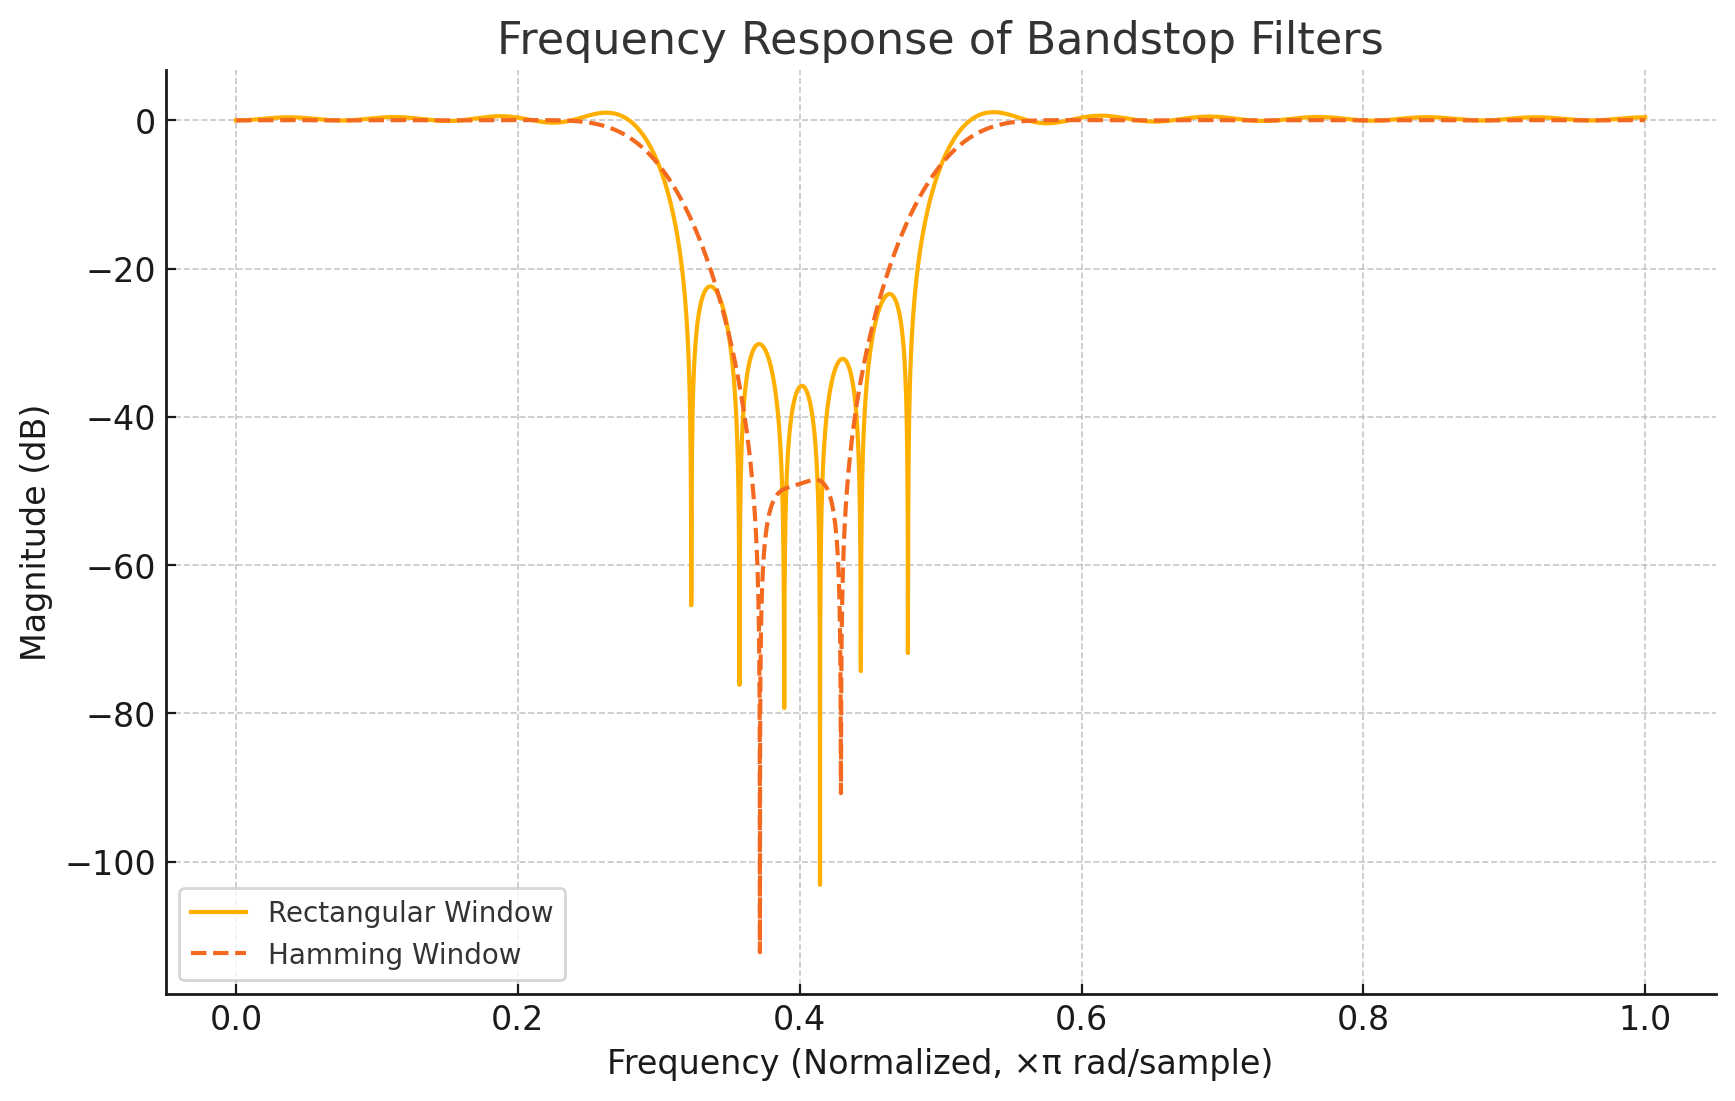
(d) Provide two sketches which show the frequency response of the bandstop for a rectangular window and for a Hamming window. [4]
idk how to remember this: but here
Question
The Fast Fourier Transform (FFT) Figure Q3 shows the discrete time (x(n)) and frequency representation (X(k)) of a spoken sentence of one second duration at a sampling rate of 44100 Hz.
(a) State the lowest fundamental frequency in the sentence and the frequency of its first harmonic. Provide an explanation. [4]
The lowest fundamental seems to be around 200Hz, and its first harmonic around 400Hz, as we would expect, as that would be 2F
Question
(b) Imagine you want to remove any low frequency noise with the Fast Fourier Transform by transforming the audio signal x(n) into the frequency spectrum X(k) with the Fast Fourier Transform, manipulating the spectrum X(k) and transforming it back.
i. Which frequency samples X(k) need to be manipulated and how. Provide a formula or formulas in Python syntax of how to manipulate the X(k). [6]
ii. Sketch the final frequency spectrum in frequency samples k = 0…N −1,X(k) after the X(k) have been manipulated to remove the low frequency noise. Indicate the exact frequency indices k in the spectrum. [6]
Lets say that low frequency noise is simply all noise below our lowest fundamental, or below 200, so lets pick 150Hz and below to be cutoff to not lose any actual signal. We can calculate the samples to be between and as well as and We can then remove up until this point. We then also remove the aliased version of these frequencies In python we can denote this as:
cutoff = int(150/44100 * N)
f_signal[:cutoff] = 0
f_signal[-cutoff:] = 0
ii cant be bothered
Question
(c) Which frequency samples X(k) need to be manipulated and how to increase the amplitude of the highest harmonics of the voice. Use your experience from the lab what improved the voice quality. [6]
If we were to amplify between 3-8kHz, we would need to amplfy between samples and as well as and
Question
(d) After having transformed the signal from the frequency domain back to the time domain x(n) you’d like to save it again as a WAV file. Which additional manipulations are required to save it as a WAV file with 16 bit signed integer? [3]
output = signal * (2**15)
wavfile.save(output)
Question
(a) In the assignment you were asked to detect two different vowels from speech with the help of the Fourier Transform. Figure Q4 shows the spectra of two vowels.
i. Describe how to distinguish between these two vowels just using their fundamental frequencies. Describe a robust approach which is independent how loud the vowels were spoken using the frequency spectrum obtained by the FFT. [6]
ii. Describe an approach to detect the two different vowels by comparing the amplitudes of harmonics. Which harmonic could be used? State its approximate frequency and how its amplitude can be used in a robust way? [6]
Two methods, the peak of vowel2 is solidly before 200Hz, more around 150-170, whereas the peak for vowel1 happens just after 200Hz, we could look at whether 190Hz is on a rising or a falling edge in terms of amplitude, if falling, vowel2, if rising, vowel1.
ii) The third harmonic for vowel 1 is very distinct, louder than the fundamental itself, in addition to this, for vowel 2, nothing around this frequency, nor its third harmonic is comparatively this strong, so we can use this analysis to robustly detect vowel 1, beyond this, from the fundamental of vowel 2 to 1kHz, there is just over 60dB of difference, which is much stronger a drop than the roughly 20dB for vowel 1, this drastic drop can be used to detect vowel 2.
Question
(b) In the assignment you detected R-peaks in an ECG with the help of wavelets. i. Sketch a wavelet and an R-peak from the ECG. [2] ii. Explain why the wavelet is ideal for detecting ECG. [3] iii. Why is it imperative that the ECG signal and the wavelet is DC free? [4] iv. What can be done to improve detection and remove wrong detections? [4]
idk