Question 1
Question
Fourier Transform (a) You have recorded audio as a mono WAV file at 16 bit resolution. State the mathematical steps of how to turn the raw samples into a frequency spectrum plot of dB against frequency. You can use either mathematical formulas or python code. [6]
1a)
f_s, wav = read(input.wav) # example function
signal = wav / 2**15
N = len(signal)
X = np.zeros(N, dtype=complex)
for k in range(N):
	X[k] = 0
	for n in range(N):
		X[k] += signal[n] * np.exp(-2j * np.pi * k * n / N)

f_sig = X[:N//2]
f_db = 20 * np.log10( np.abs(f_sig) )
freq_axis = [idx * f_s / N for idx in range(N//2)]
plot(y=f_db,x=freq_axis)
1b)
Question
(b) When a speaker addresses a microphone at close range it will cause unwanted “pop” sounds. Imagine you have 10 s of audio at 48 kHz. Explain how to use the Fourier Transform to arrive at filtered new 10 s audio which is no longer contaminated with these pop-sounds. In particular specify the index ranges of frequency samples of the fourier transformed audio which need to be manipulated and how they need to be manipulated. Use math or python notation. [6]
You can use a fourier transform to take the signal into the frequency domain, cut the unwanted frequencies off, then inverse fourier transform the signal to get the desired signal. The index of the cutoff here would be at N / f_s * cutoff or 10 * cutoff, i.e. 10x the frequency you specifically want to remove. In addition to this, due to aliasing we would also need 10x (48kHz - cutoff).
Lets say the pop sounds are happening under 100Hz:
f_s, wav = read(input.wav) # example function
signal = wav / 2**15
N = len(signal)
X = np.zeros(N)
for k in range(N):
	X[k] = 0
	for n in range(N):
		X[k] += signal[n] * np.exp(-2j * np.pi * k * n / N)

cutoff = 10 * 100 # (480,000 / 48,000) * 100Hz
X[:cutoff] = 0
X[-cutoff:] = 0

x = np.zeros(N)
for k in range(N):
	x[k] = 0
	for n in range(N):
		x[k] += X[n] * np.exp(-2j * np.pi * k * n / N)

# x now represents the desired time-domain signal
1c)
Question
(c) When recording a speaker at a far distance at 48 kHz for 10 s in a busy lab other unwanted sounds will interfere with the speaker. At the same time recording at a large distance the voice of the speaker will have no rich bass compared to recording at close range. Suggest a manipulation of the frequency spectrum which both improves base frequencies and removes unwanted background noise. Explain your reasoning and specify both the ranges of frequency indices and their gain and/or damping. [10]
At a further distance we can assume that we are no longer affected by the popping, however new noise is introduced, which we can assume for this example to be high frequency, say above 5kHz
We already established that the bass of our signal starts around 100Hz, we can assume this extends up to 400Hz for this example.
This means that we need to boost frequencies between 100-400Hz, and cutoff frequencies pass 5kHz
f_s, wav = read(input.wav) # example function
signal = wav / 2**15
N = len(signal)
X = np.zeros(N)
for k in range(N):
	X[k] = 0
	for n in range(N):
		X[k] += signal[n] * np.exp(-2j * np.pi * k * n / N)

bass_low = 10 * 100 # (480,000 / 48,000) * 100Hz
bass_high = 10 * 500 # (480,000 / 48,000) * 500Hz
noise_cutoff = 10 * 5000 # (480,000 / 48,000) * 5000Hz

X[bass_low:bass_high] *= 2
X[-bass_high:-bass_low] *= 2
X[noise_cutoff:N//2] = 0
X[-noise_cutoff:] = 0

x = np.zeros(N)
for k in range(N):
	x[k] = 0
	for n in range(N):
		x[k] += X[n] * np.exp(-2j * np.pi * k * n / N)
1d)
Question
(d) Why is removing of background chatter when recording a speaker more difficult than removing the hum of a fridge? [3]
Eliminating background chatter is far harder than eliminating something like the background hum of a fridge, as background chatter happens at the same frequencies as your target signal, and cant simply be chopped out the same way the hum, which happens at a specific frequency can. In addition to this, the hum has a relatively static frequency, whereas chatter does not.
Question 2
Question
Q2. FIR filter design in the frequency domain. (a) Sketch the frequency response of an ideal digital highpass filter with cut-off frequency ωc and perform an inverse Fourier transform of the ideal highpass filter to obtain the impulse response of the filter. [10]
2a
2b
Question
(b) ECGs often have baseline wander (i.e. low frequency drift). Your task is to design an FIR highpass filter which removes the baseline wander but keeps the ECG intact. Decide on the cutoff frequency and calculate the theoretical minimumn number of taps and practical number of taps at a sampling rate of 1 kHz. [10]
Baseline wander is typically ultra-low frequency, like 0.5Hz and below, so taking that into account we can pick a cutoff just above that (as this isnt a perfect filter).
We can say for the filter the theoretical minimum number of taps would be , a practical number would most likely be around 2x that many to allow for a better transition, so around taps
2c
Question
(c) As a window function a person chooses the Blackman window but to their surprise the filtering becomes even worse. What might have been the reason? [5]
Because the blackman window has the highest damping, it also naturally has the widest transition from stopband to passband, and in this case this might be intefering with actual data from the signal, which means in this case a window which damps less, like the hamming window could be more applicable
Question 3
Question
Q3. Adaptive filtering and LMS (a) Describe how to remove 50 Hz interference from an ECG with the help of a Least Mean Square filter (LMS). [4]
3a
You design a FIR filter that takes a pure 50Hz signal, and then have that output sum negatively into the ECG signal, which creates the error/output signal, this signal should then be fed back into the FIR filter to be the coefficients.
3b
Question
(b) Give an advantage of using an LMS filter against a 50 Hz notch filter and a disadvantage. Explain your reasoning. [4]
Advantage:
- LMS adapts to changes in interference (frequency drift, amplitude changes)
- Can track phase changes in the interference
Disadvantage:
- Requires reference signal
- More computationally intensive
- Takes time to converge
3c
Question
(c) What kind of effect has the learning rate on the filtering? What if it is too low or too high? [4]
A low learning rate causes a signal to take longer to converge but to overall be more accurate, whereas the high learning rate does the inverse. A too low learning rate would take ages to converge, whereas a too high learning rate can be unstable, and never converge
3d
Question
(d) Imagine you want to remove background chatter during a voice recording with LMS. How would you do this and what might be the challenges? Provide a sketch of the microphone placements and a dataflow diagram of how the audio is processed. [10]
Diagram like from tutorial The reference mic for the FIR filter would have to be by the chatter, whereas the desired signal mic would be by the main talking. The main challenges is that they fundamentally will have very similar frequencies, and it will be hard to remove the frequencies of one without affecting the other.
3e
Question
(e) In ECG processing you detected the R-peaks in an ECG with a matched filter. Describe the matched filter approach and in particular how to obtain the template for the matched filter. Suggest two different approaches to obtain a template for ECG detection. [3]
A matched filter approach uses cross correlation of the signal y(n) = x(k) and h(n-k), which means the correlated signals amplify, and random noise tends to cancel out.
In this case we could average out a few cleaned r peaks, to use for our matched filter, or we can create a theoretical QPRST complex to use for our correlation.
Question 4
Question
4a
Question
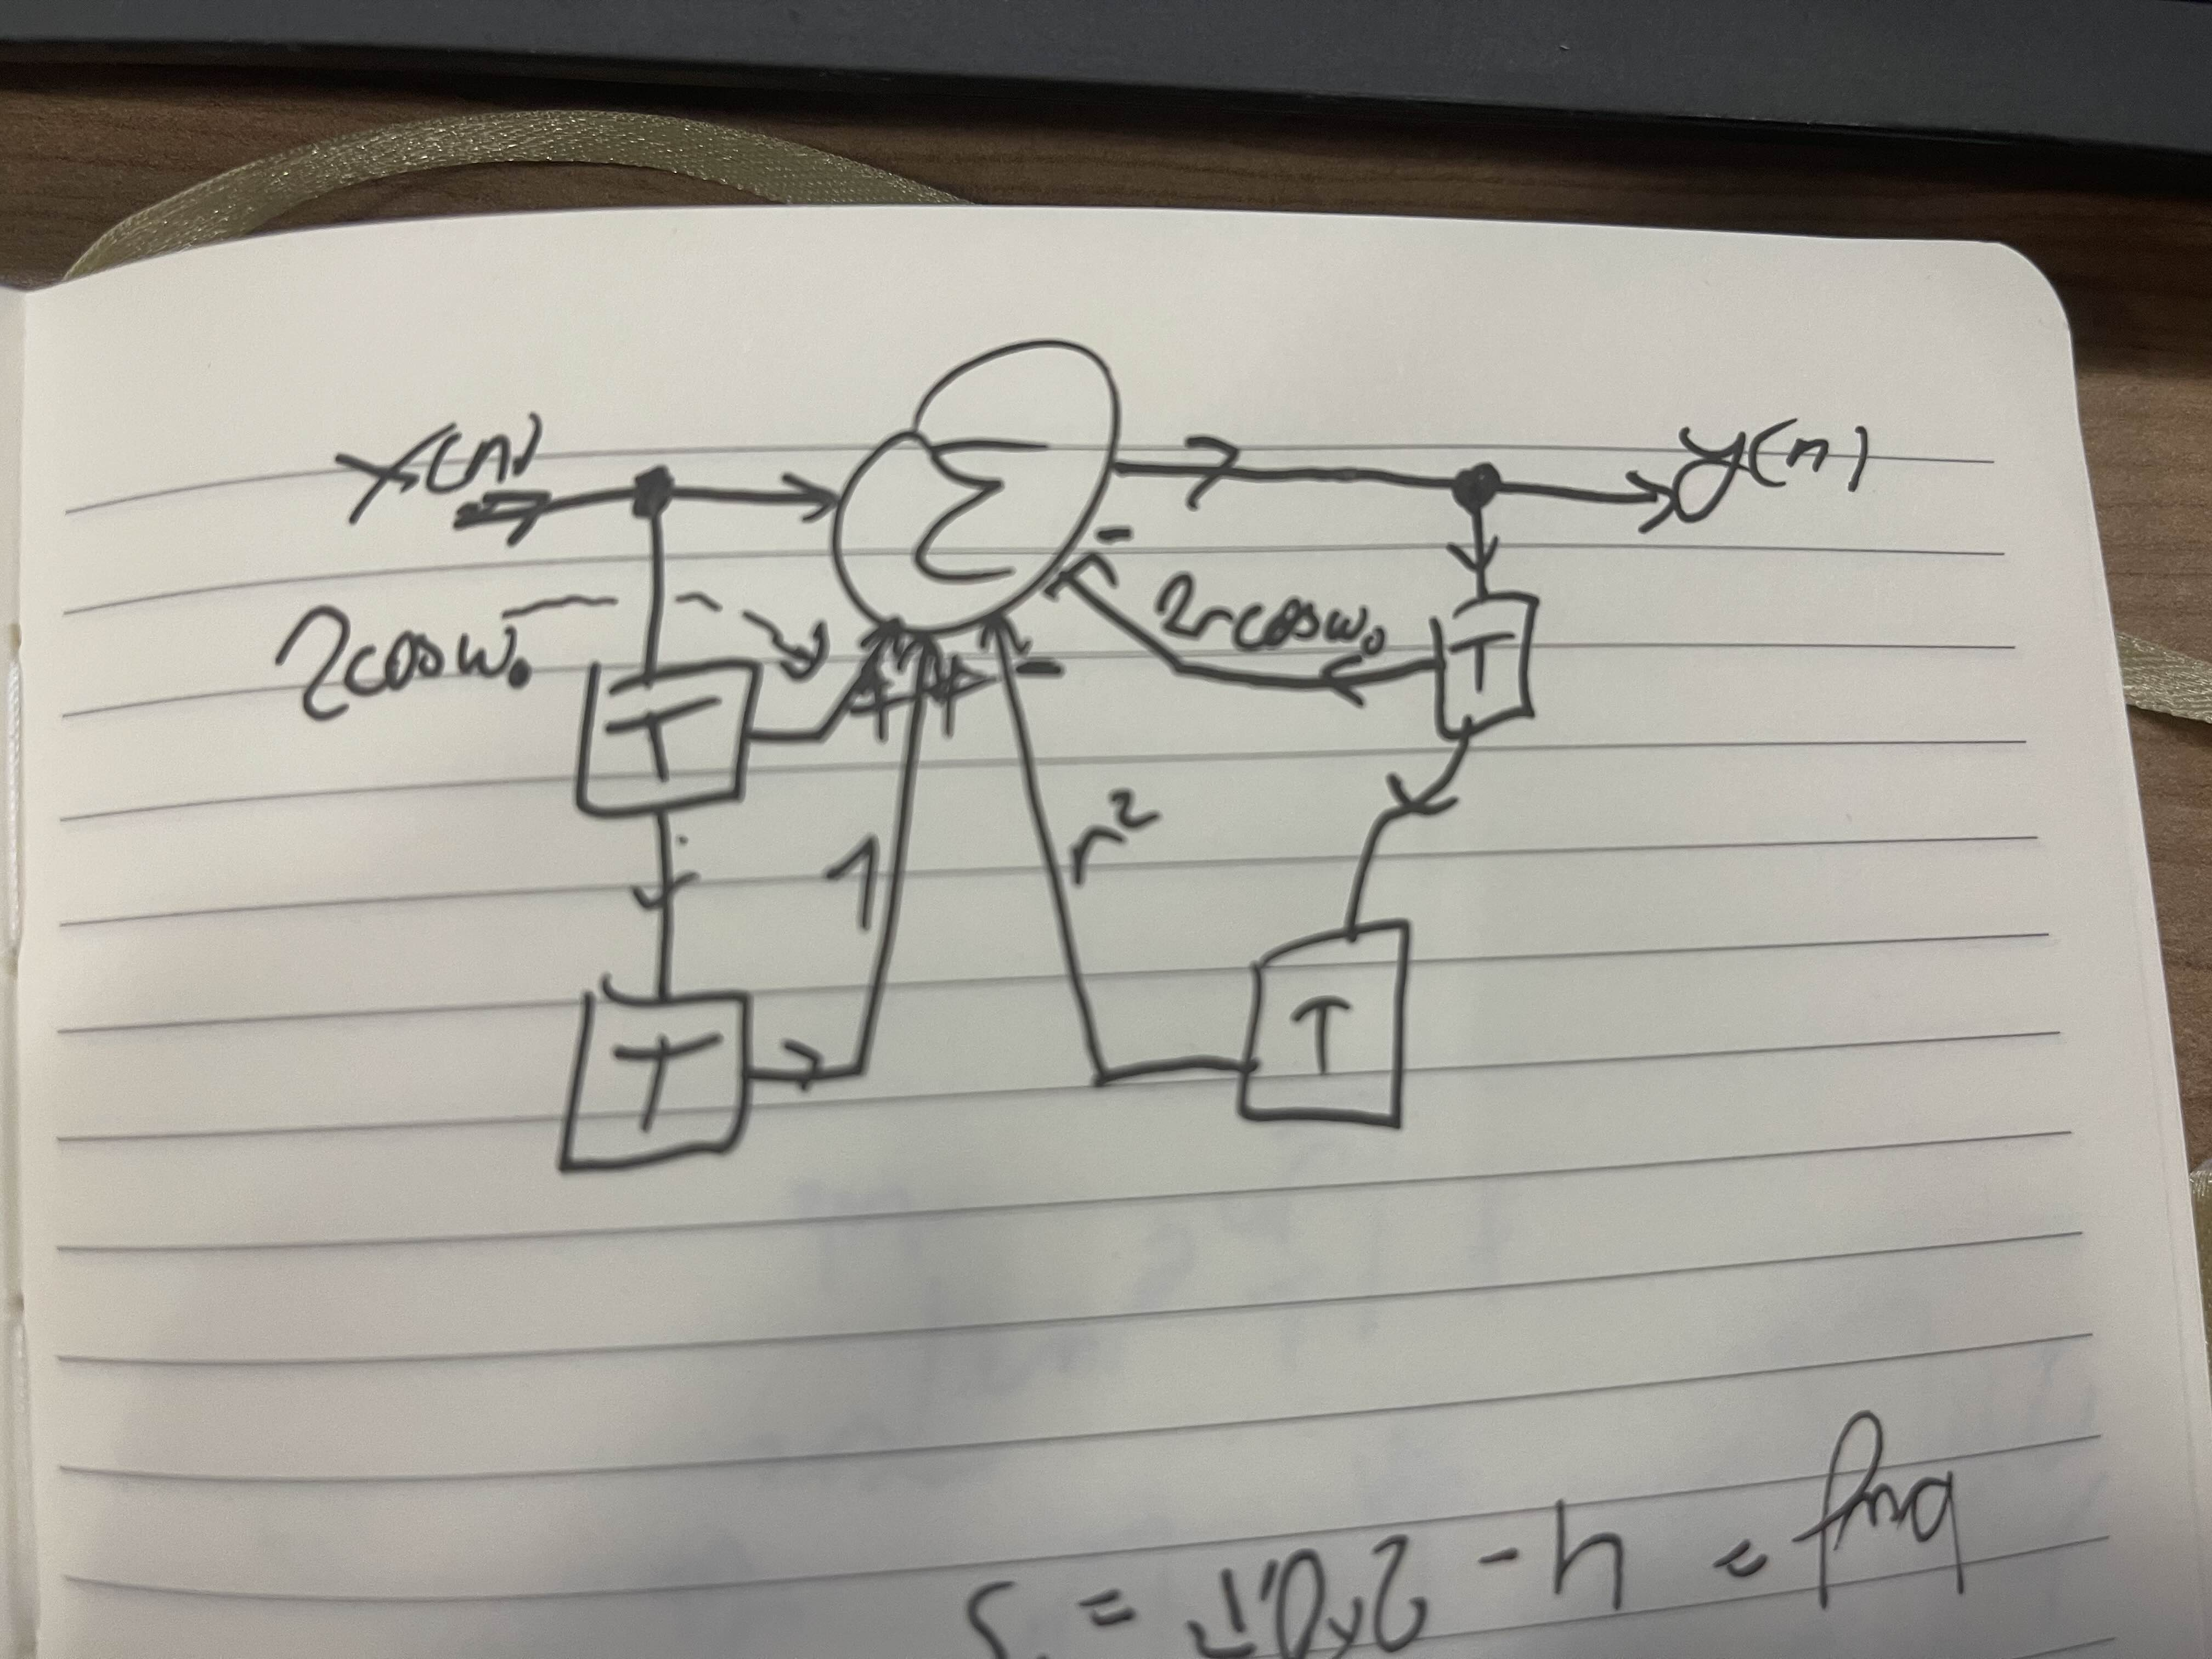
(a) A digital filter has the transfer function shown above. Draw a data flow diagram of the filter. [9]
4b
Question
(b) What value of r is required in this transfer function to guarantee stable operation of the filter? [2]
Which would keep the poles inside the unit circle
4c
Question
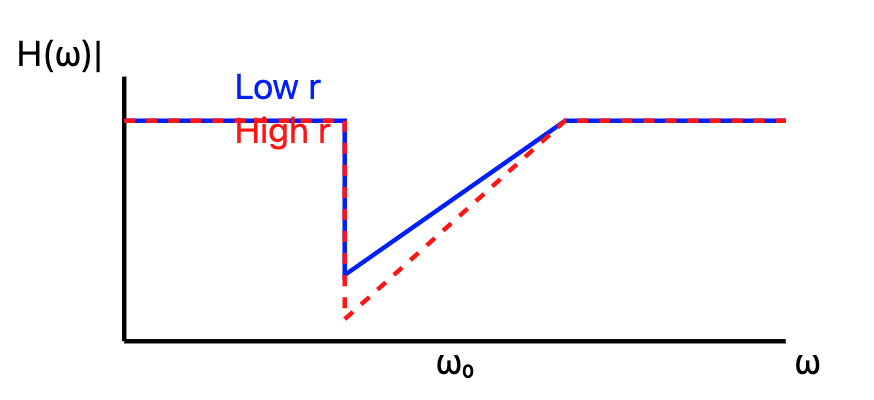
(c) Sketch the frequency response of this filter for a low value of r and a high value of r, assuming stability. [7]
- Low r: Wide notch, less attenuation
- High r (close to 1): Narrow notch, more attenuation
4d
Question
(d) A male voice is recorded at a sampling rate of 32 kHz, and there is a high-pitched noise present on the signal. The main speech component runs up to 8 kHz. Design a filter to remove the noise. Given that the filter will use the bilinear transform, calculate the design frequency necessary to achieve your objective. [7]