Abstract
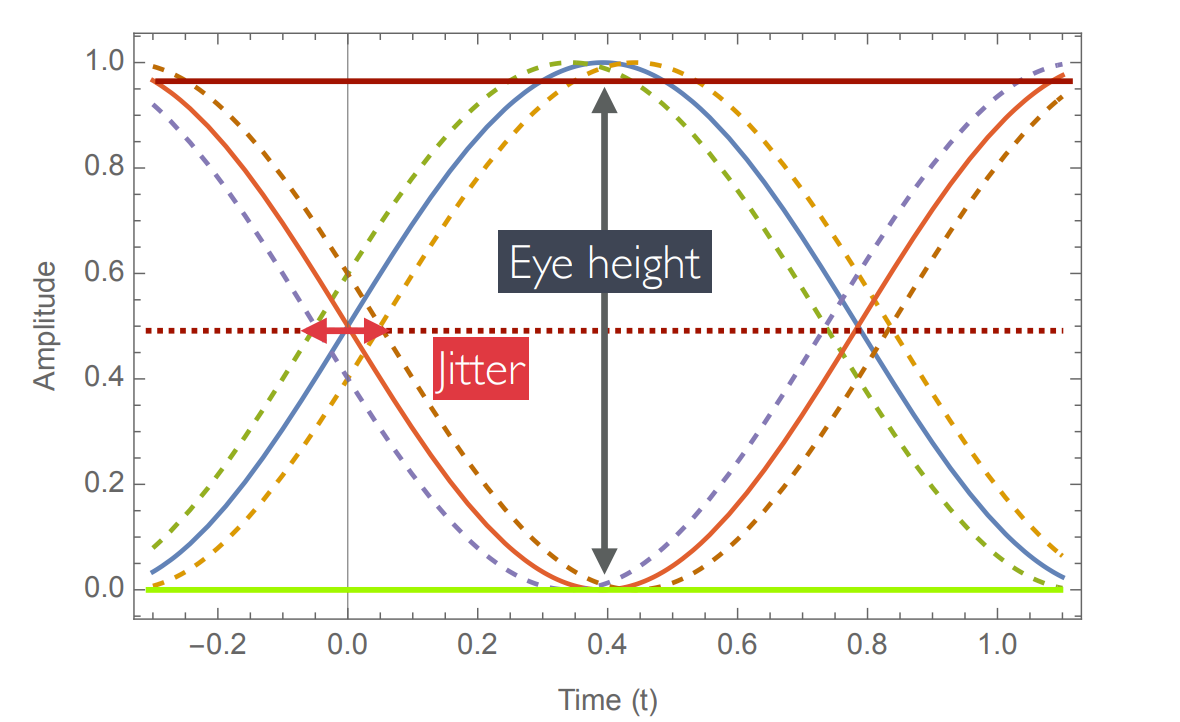
In digital systems we can say that on average over a long enough time period that we have an even distribution of 1s and 0s, which when summed over time give us a graph called an eye diagram:
This graph allows us to have a visual indication of error in a system as it presents itself as a deviation from the “ideal” signal.
Analysis
There are generally three things to consider in an eye diagram:
- Eye Height: The distance (in Voltage/Amplitude) that seperates the midpoint of the signal from the closest occurance of the signal (explained below).
- Eye Width: The distance (in time) between bit switching, typically the inverse of the baud rate. This factor affect the system much less, however you will similarly get errors if .
- Jitter:
In general in systems, your Eye Height decreases as noise increases, and when you begin to get Bit Errors